What is ChartGPT?
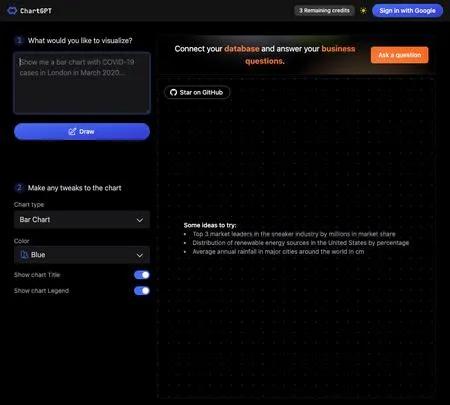
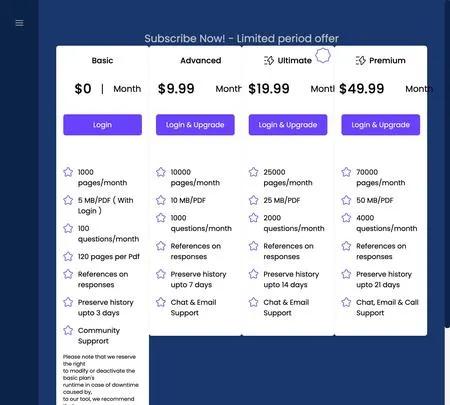
ChartGPT is a tool for visualizing and analyzing business data. By connecting your company's database and asking questions about sales trends or customer behavior, it generates answers based on data in the form of charts. This allows for decision-making based on information to be done swiftly. Furthermore, the types of charts are diverse, ranging from bar graphs to pie charts and radar graphs, allowing data to be displayed in the most suitable form. Additionally, titles and colors can be freely customized. This service can be used by purchasing 100 credits for 20 dollars, and it is also possible to download in PNG format or export to PowerPoint.
Latest Popularity Score: - (UTC)
-
